Probability: Tree Diagrams
Introduction
Tree diagrams are a powerful tool that allows one to visualize all the possible outcomes of a random activity or experiment. Each branch in a tree diagram represents a possible outcome. Furthermore, once the tree diagram is drawn and outcomes have been established, tree diagrams help one calculate the corresponding probabilities of each outcome.
Tree Diagrams & the Sample Space
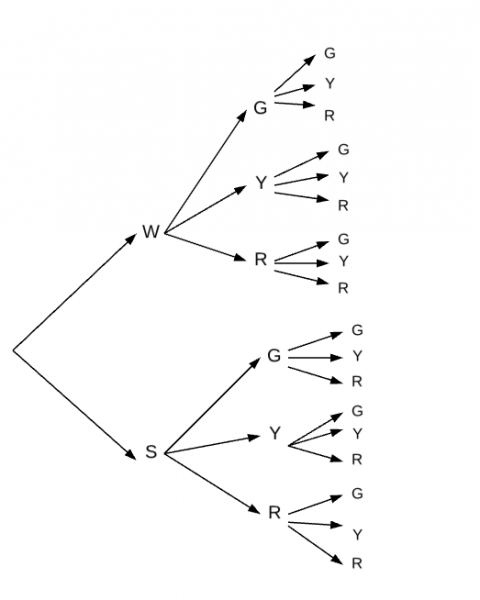
Let's say you are going on a drive to visit your friend. There are two routes: the windy route (W) or the straight route (S). On both routes, you would encounter two stop lights that can turn green (G), yellow (Y), or red (R). You want to know the sample space for what possible outcomes there are on this drive. It might seem very hard to visualize how many options there are, but with a tree diagram, it becomes much more clear.

As you can see, the sample space is:
S = {WGG, WGY, WGR, WYG, WYY, WYR, WRG, WRY, WRR, SGG, SGY, SGR, SYG, SYY, SYR, SRG, SRY, SRR}
Using Tree Diagrams to Make Calculations
Using tree diagrams, we can calculate conditional probabilities.
Example:
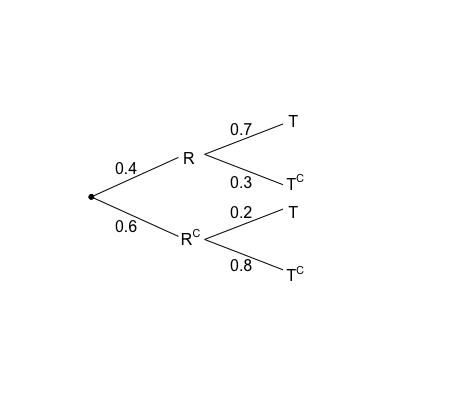
Jack drives along a rural road to work. There is a light that is only green or red. The probability the light is red is 0.4. The driver has decided he will go through the light no matter what the light shows. The probability he gets a ticket given that the light is red is 0.7. The probability Jack gets a ticket given the light is green is 0.2. Notation for hitting red light will be "R", and receiving a ticket will be "T".
Calculate (A) the probability that Jack gets a ticket given that the light is green, (B) the probability that Jack goes through a red light and gets a ticket, (C) the probability that Jack gets a ticket, and (D) the probability that Jack has gone through a red light given that he got a ticket.
Solution:
Let's begin by drawing a tree diagram.

(A)
To find the probability that Jack gets a ticket given that the light is green, we must look at the tree diagram we have filled out. Follow the "Green" path and go then find the probability corresponding to "T" for ticket. According to our tree diagram, the probability is 0.2.
(B)
To find the probability that Jack goes through a red light and gets a ticket, we will have to perform some calculations.
P(Red Light and Ticket) = P(Red Light) x P(Ticket | Red Light) = 0.4 x 0.7 = 0.28
(C)
To find the probability that Jack gets a ticket, we will have to consider the probability that the light was green and Jack got a ticket OR the probability that the light was red and Jack got a ticket.
P(Ticket) = P(Green Light and Ticket) or P(Red Light and Ticket) = P(Green Light and Ticket) + P(Red Light and Ticket)
P(Green Light and Ticket) = P(Green) x P(Ticket | Green) = (0.6) x (0.2) = 0.12
P(Red Light and Ticket) = P(Red) x P(Ticket | Red) = (0.4) x (0.7) = 0.28
P(Green Light and Ticket) + P(Red Light and Ticket) = 0.12 + 0.28 = 0.4
(D)
To find the probability that Jack went through a red light given that he got a ticket, we must use the following formula: \(P(R | T) = { P(R and T) \over P(T) }\)
Let's break it down:
P(Red Light and Ticket) = P(Red) x P(Ticket | Red) = 0.4 x 0.7 = 0.28
In part C, we found the probability of getting a ticket. P(Ticket) = 0.4
Thus, \(P(R | T) = { P(R and T) \over P(T) } = { 0.28 \over 0.4 } \) = 0.7
