Density Curves
Introduction
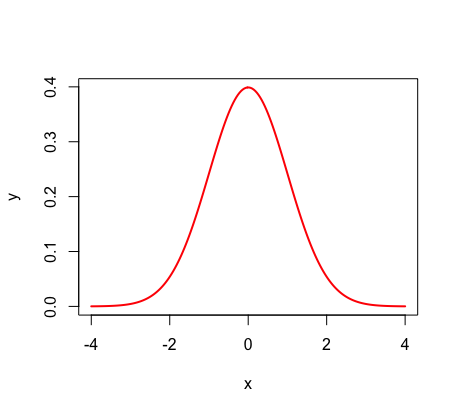
A density curve is a graphical representation of a numerical distribution where the outcomes are continuous. In other words, a density curve is the graph of a continuous distribution. This means that density curves can represent measurements such as time and weight (which are continuous), and NOT situations such as rolling a die (which would be discrete). Density curves lie above or on a horizontal line, as displayed in the bell shaped "normal distribution" (one of the most common density curves).

There are a few essential rules about density curves:
These two rules go hand in hand because probability has a range of 0 (impossible) to 1 (certain). Hence, the total area under a density curve, which represents probability, must equal 1.
*For more information on basic probability, see the 'Introduction to Probability' help page.
Uniform Density Curves
Curves are "uniform" when the probabilities for all outcomes are the same. Hence, each outcome has the same frequency. Because of this, the height at each point on the x-axis is identical and the shape of a uniform density curve becomes a rectangle.

Given that the area under the density curve must equal 1, one can calculate both the height of a density curve and the probability of certain outcomes.
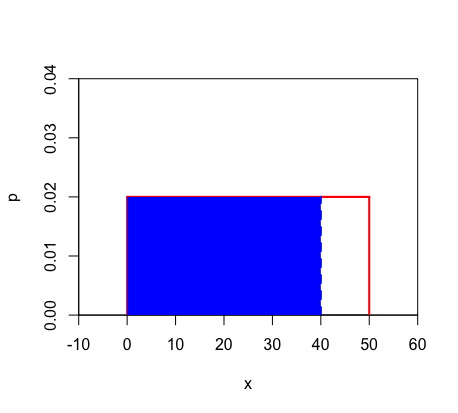
To understand the second and third rules, remember that the probability is equal to the area. For P(x < a), one shades to the left of the point and thus creates a rectangle of area (see example below for visual). For a single point x = a, there would be nowhere to shade left, causing the rectangle of area to have no width and thus no probability. Therefore, the probability that x = a is zero, and the probability that x < a must be the same as the probability that x ≤ a.
Example: Given a uniform density curve with a length of 50, calculate the following:
A) height of density curve
Recall that the area must equal 1, and that uniform density curves are rectangular. Thus, we can set up the equation base x height = 1 → (50)(h) = 1 → height = 0.02
B) P(x < 40)
Step 1) Shade in the area.

Step 2) Find the area of the shaded rectangle using the height you calculated. → area = (40)(0.02) = 0.8
C) P(x = 40)
If you attempt to follow the steps from part B, you will quickly see that there is no area that can be shaded in since this rectangle of area would have no width. Thus, the probability is equal to zero.

D) P(x > 40)
Option 1: Shade in the area on your density curve and then calculate this area using 10 as the base and NOT 40. → area = (10)(0.02) = 0.2
Remember that the base of your rectangle is not 40; you are finding the area GREATER than 40, and thus the base = 50 - 40 = 10.
Option 2: Find P(x < 40) and then subtract this from 1. → 1 - P(x < 40) = 1 - { (40)(0.02) } = 1 - 0.8 = 0.2
